Software Developer Performance Metrics: How to Measure Productivity the Right Way

• 10 min
I'm a content specialist at Fively keen on writing fresh articles that can help out business and tech specialists. I love to conduct research, hold interviews, and spotlight sophisticated tech issues.
This article explores the most effective software developer performance metrics, helping IT managers measure what truly drives productivity, quality, and business success.
Measuring software developer performance has always been tricky. Lines of code or hours worked don’t capture the true impact of an engineer. In today’s product environment, companies need smarter ways to measure developer productivity, collaboration, and quality.
This article breaks down the most effective software developer performance metrics, helping leaders go beyond vanity stats and focus on what really drives business value.
Why Measure Developer Performance Metrics?
For managers, measuring developer performance isn’t about micromanaging or counting keystrokes — it’s about aligning engineering work with business outcomes. Without clear performance metrics, teams risk falling into guesswork, where productivity is based on perception rather than evidence.
1. Ensure Business Alignment
By tracking the right metrics, leaders can see whether development team effort translates into product improvements, customer value, and revenue growth. This helps bridge the gap between engineering and business stakeholders.
2. Improve Productivity & Efficiency
Metrics highlight bottlenecks in workflows — whether it’s long code review cycles, recurring bugs, or missed deadlines. With data, managers can identify inefficiencies and remove obstacles that slow down delivery.
3. Enhance Quality & Reduce Risk
Measuring error rates, test coverage, and release stability provides early warning signals before small issues turn into costly problems. Quality-focused metrics safeguard both the product and the company’s reputation.
4. Support Fair Evaluation & Growth
Objective performance data ensures that evaluations are based on results, not gut feelings. This gives managers a clearer picture of who needs mentorship, who is excelling, and how to design tailored career paths.
5. Strengthen Team Collaboration
Metrics don’t just measure individuals — they reveal how teams work together. Collaboration, knowledge sharing, and cross-functional effectiveness are just as important as individual output.
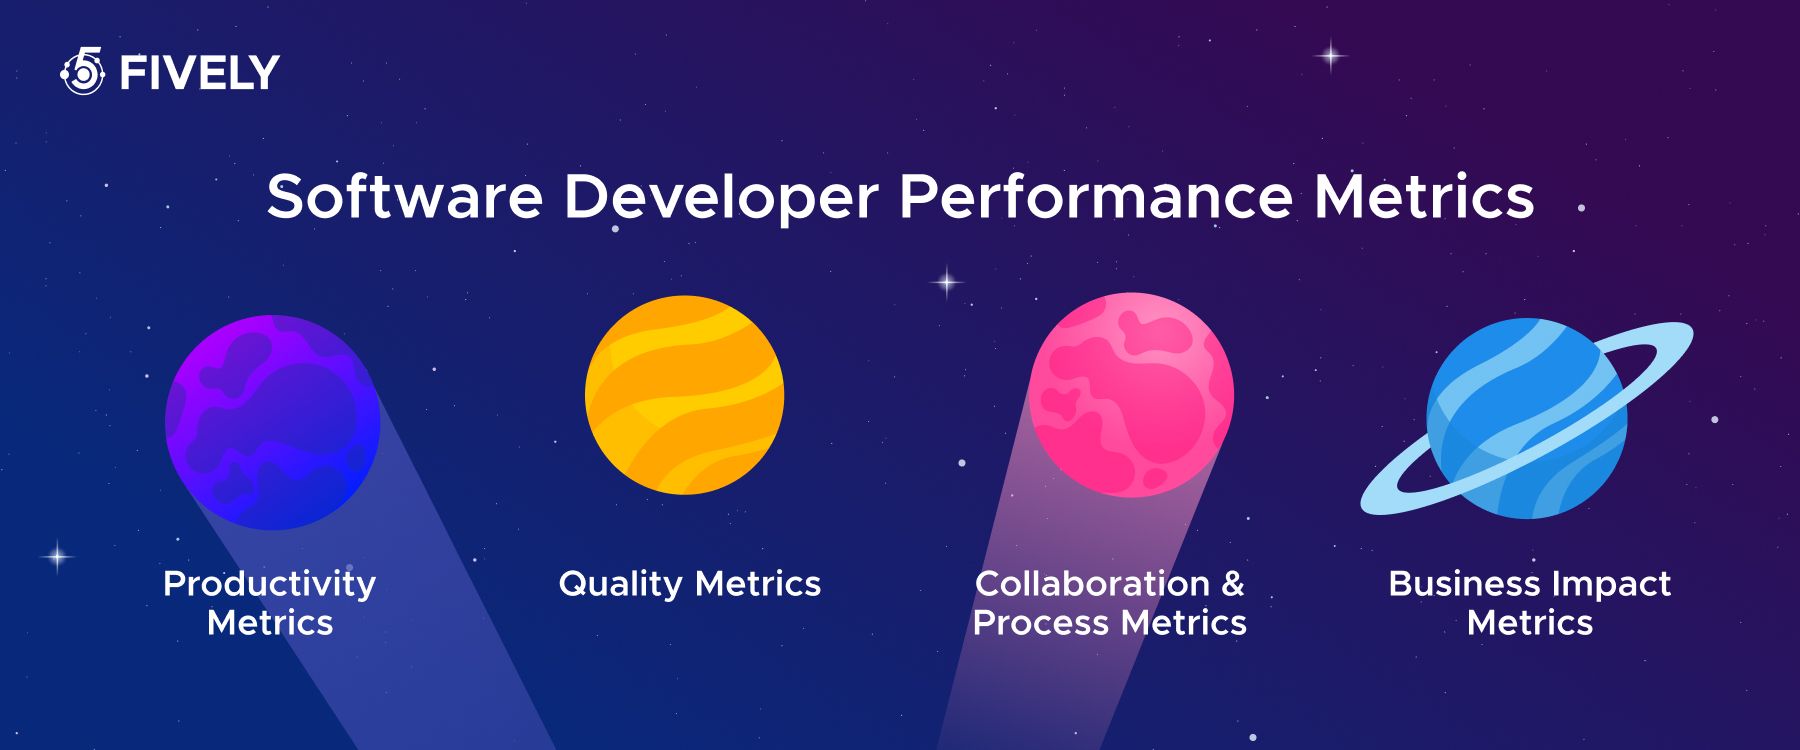
Types of Software Development Metrics
When you need to measuring developer performance, not all metrics are created equal. The right mix gives managers visibility into productivity, quality, and impact, while avoiding vanity numbers that don’t reflect real value. Broadly, software development metrics fall into four key categories:
1. Productivity Metrics
These measure how efficiently work gets delivered. Examples include:
- Velocity – number of story points or tasks completed in a sprint.
- Cycle Time – how long it takes to move a task from start to finish.
- Lead Time – the total time from when a feature is requested to when it’s delivered.
This metrics helps managers spot bottlenecks and improve delivery speed.
2. Quality Metrics
Code quantity is meaningless without code quality. These metrics track product stability and maintainability, and helps to ensure engineering teams are shipping robust, maintainable solutions:
- Defect Density – number of bugs per lines of code or features delivered.
- Code Churn – how often code is rewritten or reworked.
- Test Coverage – percentage of code covered by automated tests.
3. Collaboration & Process Metrics
Development is teamwork, so it’s important to measure how well teams work together:
- Code Review Turnaround Time – speed and quality of peer reviews.
- Commit Frequency – how often developers contribute incremental code.
- Cross-Team Dependencies – tracking delays caused by waiting on other teams.
4. Business Impact Metrics
Ultimately, performance should be tied to outcomes that matter to the business:
- Feature Adoption Rate – how often new features are actually used by customers.
- Customer Satisfaction (CSAT/NPS) – user feedback on product quality.
- Revenue/ROI Contribution – whether engineering work aligns with growth goals.
14 Best Software Developer Performance Metrics
Now, let’s look at the top developer metrics we picked out for you: together, these 14 metrics cover speed, quality, collaboration, and also measuring developer well-being.
Deployment Frequency
Measures how often new code is successfully deployed to production. Frequent, smaller releases show adaptability, while low frequency may point to bottlenecks or risk-averse practices.
- Measurement: Count the number of deployments per day, week, or month.
- How does tracking this metric help? Frequent deployments signal agility and continuous delivery capability, showing how fast the team can ship value to users.
Cycle Time
The total time it takes for a task to move from start to completion. It reflects the smoothness of workflows and helps identify stages where tasks get stuck.
- Measurement: Track elapsed time from “in progress” status to “done” in project management tools.
- How does tracking this metric help? Reveals bottlenecks and inefficiencies in the coding process, enabling managers to speed up delivery.
Change Failure Rate
Percentage of deployments that result in incidents, failures, or rollbacks. It is a key indicator of release quality and the robustness of testing practices.
- Measurement: Divide the number of failed deployments by the total number of deployments.
- How does tracking this metric help? Lower rates mean more reliable releases and stronger quality control in production.
Mean Time to Recovery (MTTR)
Average time needed to restore service after a production incident. This metric reflects how resilient the system is and how effective the incident response process can be.
- Measurement: Measure elapsed time from incident detection to full recovery.
- How does tracking this metric help? A shorter MTTR demonstrates resilience and effective incident response, reducing downtime impact.
Velocity
The amount of work a team delivers within a sprint. It’s often measured in story points and helps track how much the team can realistically commit to.
- Measurement: Sum of completed story points or tasks per sprint.
- How does tracking this metric help? Provides insight into team capacity and supports more accurate sprint planning.
Sprint Burndown
Tracks remaining work compared to time left in a sprint. It visually shows progress and helps highlight whether the team is on track to hit goals.
- Measurement: Compare planned vs. completed work daily on a burndown chart.
- How does tracking this metric help? Shows if the team is on pace to meet commitments and highlights potential scope or execution issues.
Code Churn
Measures how much code is rewritten or discarded shortly after being written. High churn often signals unclear requirements or low-quality initial implementations.
- Measurement: Percentage of lines changed, deleted, or rewritten within a given time frame.
- How does tracking this metric help? High churn can indicate unclear requirements, poor planning, or technical inefficiencies.
Test Coverage
The proportion of codebase covered by automated tests. It shows how well the system is protected against regressions and helps maintain confidence in future changes.
- Measurement: Percentage of lines, functions, or modules tested.
- How does tracking this metric help? Higher coverage builds confidence in releases, lowers production bug rates, and supports faster changes.
Code Review Time
Average time taken for pull requests to be reviewed and approved. It reflects the team’s responsiveness and collaboration culture.
- Measurement: Time from PR submission to review completion.
- How does tracking this metric help? Faster reviews improve collaboration and accelerate feature delivery.
Pull Request Size
The number of lines or files changed in a single pull request. Smaller PRs encourage easier reviews, while larger ones increase complexity and risk.
- Measurement: Average lines of code or file count per PR.
- How does tracking this metric help? Smaller PRs are easier to review, less risky, and lead to higher-quality merges.
Technical Debt Ratio
The cost of fixing issues relative to the cost of building the system. A high ratio suggests the codebase may become harder to maintain over time.
- Measurement: Divide remediation cost by development cost, often tracked via code analysis tools.
- How does tracking this metric help? Indicates long-term code maintainability and whether debt is accumulating dangerously.
Production Incidents
Number of critical issues that impact end users in live environments. These incidents are the most visible form of software quality for customers.
- Measurement: Count incidents logged per week or month.
- How does tracking this metric help? Fewer incidents mean more stable software and higher customer trust.
Defect Detection Rate
Percentage of bugs found before release compared to after release. A higher rate pre-release indicates effective QA and testing practices.
- Measurement: Compare pre-release QA bugs to post-release production bugs.
- How does tracking this metric help? Higher detection rates pre-release reduce costs, risks, and user-facing issues.
Developer Satisfaction / Engagement
Measures how motivated and supported developers feel in their roles. Engagement reflects not just happiness but also how emprove developers engagement are hepl them to do their best work.
- Measurement: Regular surveys, eNPS (Employee Net Promoter Score), or engagement tools.
- How does tracking this metric help? High satisfaction correlates with lower turnover, better collaboration, and sustained productivity.
 Services Account
Measuring developer performance works best when guided by proven frameworks rather than ad-hoc numbers. Recognized models like DORA metrics, the SPACE framework, and the Developer Experience (DevEx) framework provide structured approaches to evaluate engineering performance holistically. It managers can use these metrics to improve their software engineering process:
DORA Metrics (Deployment Research Program)
These four are industry standards for evaluating DevOps and software delivery performance:
- Deployment Frequency – How often the team successfully releases to production.
- Lead Time for Changes – Time from code commit to production release.
- Change Failure Rate – Percentage of deployments causing failures or rollbacks.
- Mean Time to Recovery (MTTR) – How quickly the team restores service after an incident.
SPACE Framework Metrics
SPACE expands the view beyond delivery speed to include satisfaction, collaboration, and quality:
- Developer Satisfaction & Well-being – Survey-based measure of how supported developers feel.
- Performance Outcomes – Business results linked to engineering output.
- Activity Metrics – Indicators like commits, reviews, or features completed (without overemphasis).
- Communication & Collaboration – Responsiveness in reviews, cross-team coordination.
- Efficiency & Flow – How smoothly developers progress through tasks without interruptions.
Developer Experience (DevEx) Metrics
DevEx focuses on tracking developer’s environment and workflow:
- Tooling Quality – Reliability and usability of internal developer tools.
- Onboarding Experience – How quickly new hires become productive.
- Cognitive Load – The mental overhead required to understand systems and processes.
Developer Performance Metrics That Don’t Work
Not all metrics are useful — some can even be misleading and harm team morale if taken out of context. Vanity metrics measure activity, not outcomes. They can be gamed easily, distract from true goals, and create unhealthy incentives. Here are the most common ones to avoid:
Number of Code Lines
Why it doesn’t work: Writing more lines doesn’t mean better code. In fact, good developers often solve problems with fewer, cleaner lines. Measuring this encourages bloated, inefficient code instead of quality.
Git Commits
Why it doesn’t work: Frequent commits don’t guarantee progress. A developer might make many small commits without delivering meaningful outcomes, or fewer, well-structured commits that deliver real value.
Number of Hours Logged In
Why it doesn’t work: More hours at the desk don’t equal productivity. This metric incentivizes presenteeism over effectiveness and ignores factors like focus, flow, and creative problem-solving.
Bugs Fixed
Why it doesn’t work: Fixing many bugs can mean either productivity or poor quality upstream. Without context, this metric rewards firefighting instead of preventing issues in the first place.
Tasks Completed
Why it doesn’t work: Completing tasks doesn’t show if they were the right tasks or if they added business value. It risks turning software engineering into a box-ticking exercise instead of strategic work.
Pull Request Count
Why it doesn’t work: A high number of PRs doesn’t necessarily mean higher productivity. Quality, size, and impact of PRs matter far more than raw quantity.
Wrapping Up
Measuring developer performance is not about tracking every click or line of code — it’s about building visibility into how engineering work drives business outcomes. When managers focus on the right metrics, they empower teams to deliver faster, improve quality, and stay aligned with company goals.
Frameworks like DORA, SPACE, and DevEx remind us that performance is multi-dimensional: speed, quality, collaboration, and developer satisfaction all play a part in long-term success. At the same time, avoiding vanity metrics ensures teams aren’t reduced to numbers, but recognized for the real value they create.
At Fively, we help businesses build smart, data-driven solutions that support this philosophy. Whether it’s developing custom dashboards, integrating AI-driven analytics, or designing end-to-end software platforms, our mission is to give leaders the tools to measure what matters and help engineering teams thrive.
With the right metrics and the right partner, your teams can deliver at their best and keep your business ahead of the curve. Feel free to contact us, and we will help your app idea turn into a top-market solution!
Services Account
Need Help With A Project?
Drop us a line, let’s arrange a discussion
Frequently Asked Questions
Developer productivity metrics are measurable indicators that show how efficiently and effectively software engineers deliver value. They go beyond raw activity (like lines of code) and focus on meaningful outcomes such as delivery speed, code quality, collaboration, and alignment with business goals. Examples include cycle time, deployment frequency, defect detection rate, and developer satisfaction.
Tracking development metrics gives managers and teams visibility into where time and effort are spent, how smoothly workflows run, and whether engineering output contributes to business success. Benefits include: identifying and removing bottlenecks, improving product quality and stability, enabling fair and data-driven performance evaluations, aligning development work with strategic business outcomes, and supporting continuous improvement and innovation.
Accuracy comes from choosing the right metrics and applying them in context. To maximize reliability, try to avoid vanity metrics like lines of code or hours logged; use recognized frameworks such as DORA, SPACE, and DevEx for holistic measurement; combine quantitative data with qualitative feedback from retrospectives, surveys, and peer reviews; standardize data collection methods across teams to ensure consistency; focus on trends over snapshots — look at patterns over time rather than isolated numbers.
At Fively, we specialize in building custom software solutions that help companies track and optimize developer performance with accuracy and confidence. From implementing DORA, SPACE, and DevEx-based dashboards to integrating AI-driven analytics and automated reporting, we ensure your engineering metrics go beyond vanity stats and reflect real business impact. Our team helps you create scalable, secure, and easy-to-use tools that empower managers to measure what truly matters — driving productivity, improving quality, and unlocking long-term growth.


